The Terpene Topography of Cannabis Strains
A Scientific Approach to Understanding Cannabis.
Why Strain Names Fall Short.
For years, cannabis has been categorized using broad labels like Indica, Sativa, and Hybrid—but these classifications don’t fully capture a strain’s chemical makeup or effects. Strain names are often inconsistent leading to confusion for consumers and industry professionals alike.
A more precise way to classify cannabis is through its ingredients, primarily its terpene profile—the aromatic compounds responsible for flavor, scent, and potential effects. By analyzing thousands of lab-tested strains, The Strain Data Project™ developed a terpene-based classification system that better represents cannabis varieties.
How SDP Analyzed Cannabis Terpenes
To create a meaningful classification system, The Strain Data Project™ utilized data from a state-certified cannabis laboratory to conduct a large-scale study on thousands of cannabis samples. Here’s how:
Collecting & Processing Data
Advanced Lab Testing: The cannabis testing lab used Gas Chromatography (GC-MS/FID) to analyze terpenes in over 2,400 unique strains, identifying both their presence and concentration.
Data Refinement: The dataset was standardized and cleaned, focusing only on Type I (or high-THC, low-CBD) strains to ensure consistency.
Identifying Patterns in Terpene Composition
Principal Component Analysis (PCA): This method highlighted key terpenes that differentiate strains, showing which compounds drive the most variation.
Cluster Analysis: SDP grouped strains based on similar terpene profiles, revealing SIX categories.
Discovering the Categories of Cannabis
Breaking Strains into Clusters
Through K-Means Clustering, SDP identified SIX primary strain categories, each with distinct terpene profiles. These groupings can potentially help consumers understand strains not just by name, but by their actual chemical makeup.
----------
Click on each tab to explore the key visualizations from the Strain Data Project's™ analysis.
-
HEADER SCREE PLOT
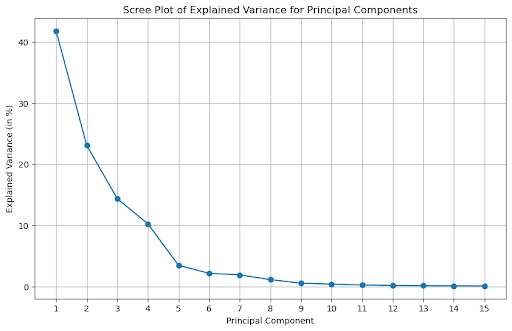
A principal component analysis was used to reduce the complexity of the terpene dataset and highlight patterns. It creates new variables called principal components (PC) that summarize the dataset by explaining the most variation in the data. This helps to understand the relationships between terpenes and identify key trends.
The scree plot shows how much variance each PC explains. The first five PCs account for 89.5% of the variation in the dataset. This means they capture most of the chemical distinction between strains.
----------
-
HEADER HEATMAP
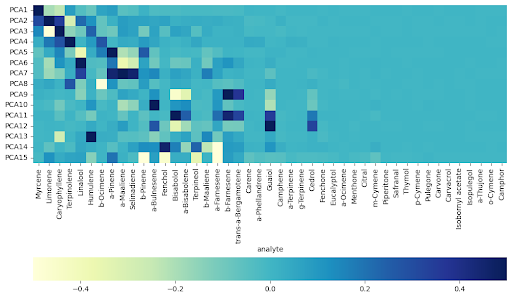
The heatmap shows how much each terpene contributes to the PCs. More intense colors mean a stronger correlation, with positive and negative values showing how terpenes relate to each PC.
This highlights which terpenes are the most influential for each component. Terpenes were ranked based on how much they contribute to the variance explained by all PCs. The top-ranked terpenes are the most important for understanding differences between the samples.
----------
-
HEADER SILHOUETTE METHOD
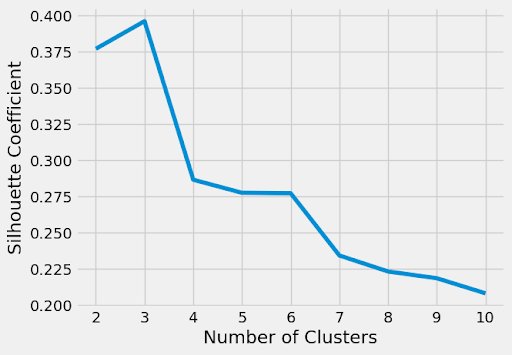
The Silhouette Method helps to identify the best number of clusters
This method, which measures how well samples fit within their clusters, found the best grouping at three (3) clusters. Another possible grouping at six (6) clusters was also noted, suggesting a potential alternative for granularity.
----------
-
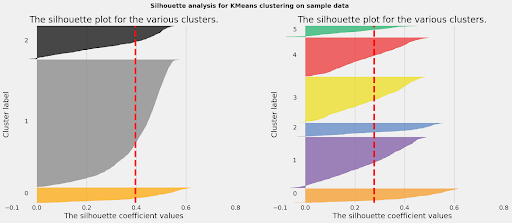
HEADER SILHOUETTE PLOT
A Silhouette plot visually shows how well samples fit into their clusters. In this analysis, the six-cluster solution distributed strains more evenly across clusters compared to the three-cluster solution.
All six clusters had Silhouette Coefficients above the average (marked by the vertical red line), meaning that most samples were correctly grouped into their clusters with clear separation and compactness.
----------
-
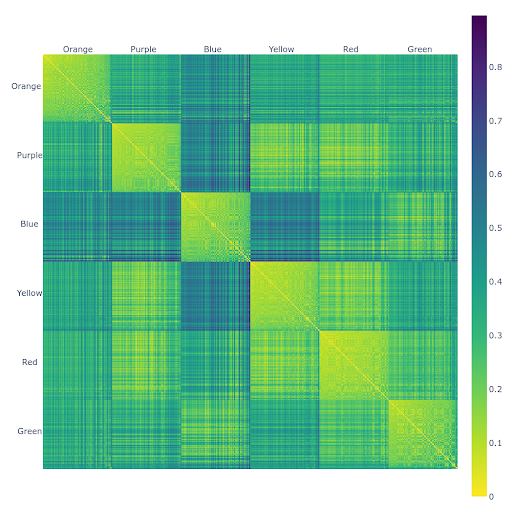
HEADER EUCLIDEAN DISTANCE
The Euclidean Distance Heatmap illustrates how closely related certain strains are to one another. A random subset of 100 strains from each of the six categories was selected due to the limited pixel capacity of the screen.
Pixel Intensity reflects similarity. Brighter pixels indicate more similarity in terpene profiles. Darker pixels indicate greater differences. Strains are grouped by category and ordered based on proximity to their cluster centroids.
OBSERVATIONS
- Yellow, Red, and Purple strains are most similar to each other.
- Green and Blue strains also show similarities.
- Blue strains are distinct from Yellow and Purple but somewhat overlap with Red.
- Blue and Orange strains show significant dissimilarity.
----------
-
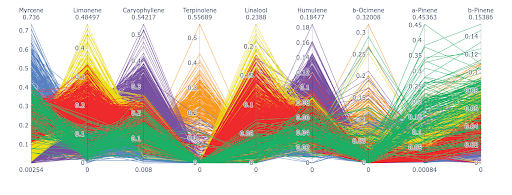
HEADER PARALLEL COORDINATE PLOT
The Parallel Coordinate Plot is a tool for visualizing complex, high-dimensional data.
Each line represents a strain. The axes are terpenes, and the line’s position shows each strain’s values for these terpenes. The colors represent the different strain categories.
INSIGHTS
Patterns emerge between terpene levels and strain categories.
For example, samples with high myrcene levels and low limonene levels tend to belong to the same category. This suggests a possible relationship between these two terpenes.
----------
Validating SDP Classification Against Traditional Labels
To determine whether SDP's six terpene-based classifications align with traditional Sativa, Indica, and Hybrid labels, we conducted an additional analysis:
- 2149 observations from 151 strains were categorized by both the Strain Compass™ system and their conventional cultural classification.
- A Chi-Squared Test was performed to examine the independence of the two classification methods.
- The null hypothesis was strongly rejected, confirming a significant correlation between the two systems.
Key Findings:
- Orange strains were classified as Sativa almost three times more often than expected under an independent classification.
- Yellow and Green strains were 30% more likely to be classified as Indica.
- Red strains were 40% more likely to be classified as Hybrid.
By combining this statistical validation with the Silhouette Plot analysis (described above), the Venn Diagram visualization was derived. The Venn Diagram showcases the overlap between traditional classifications and the SDP terpene-based categories.