
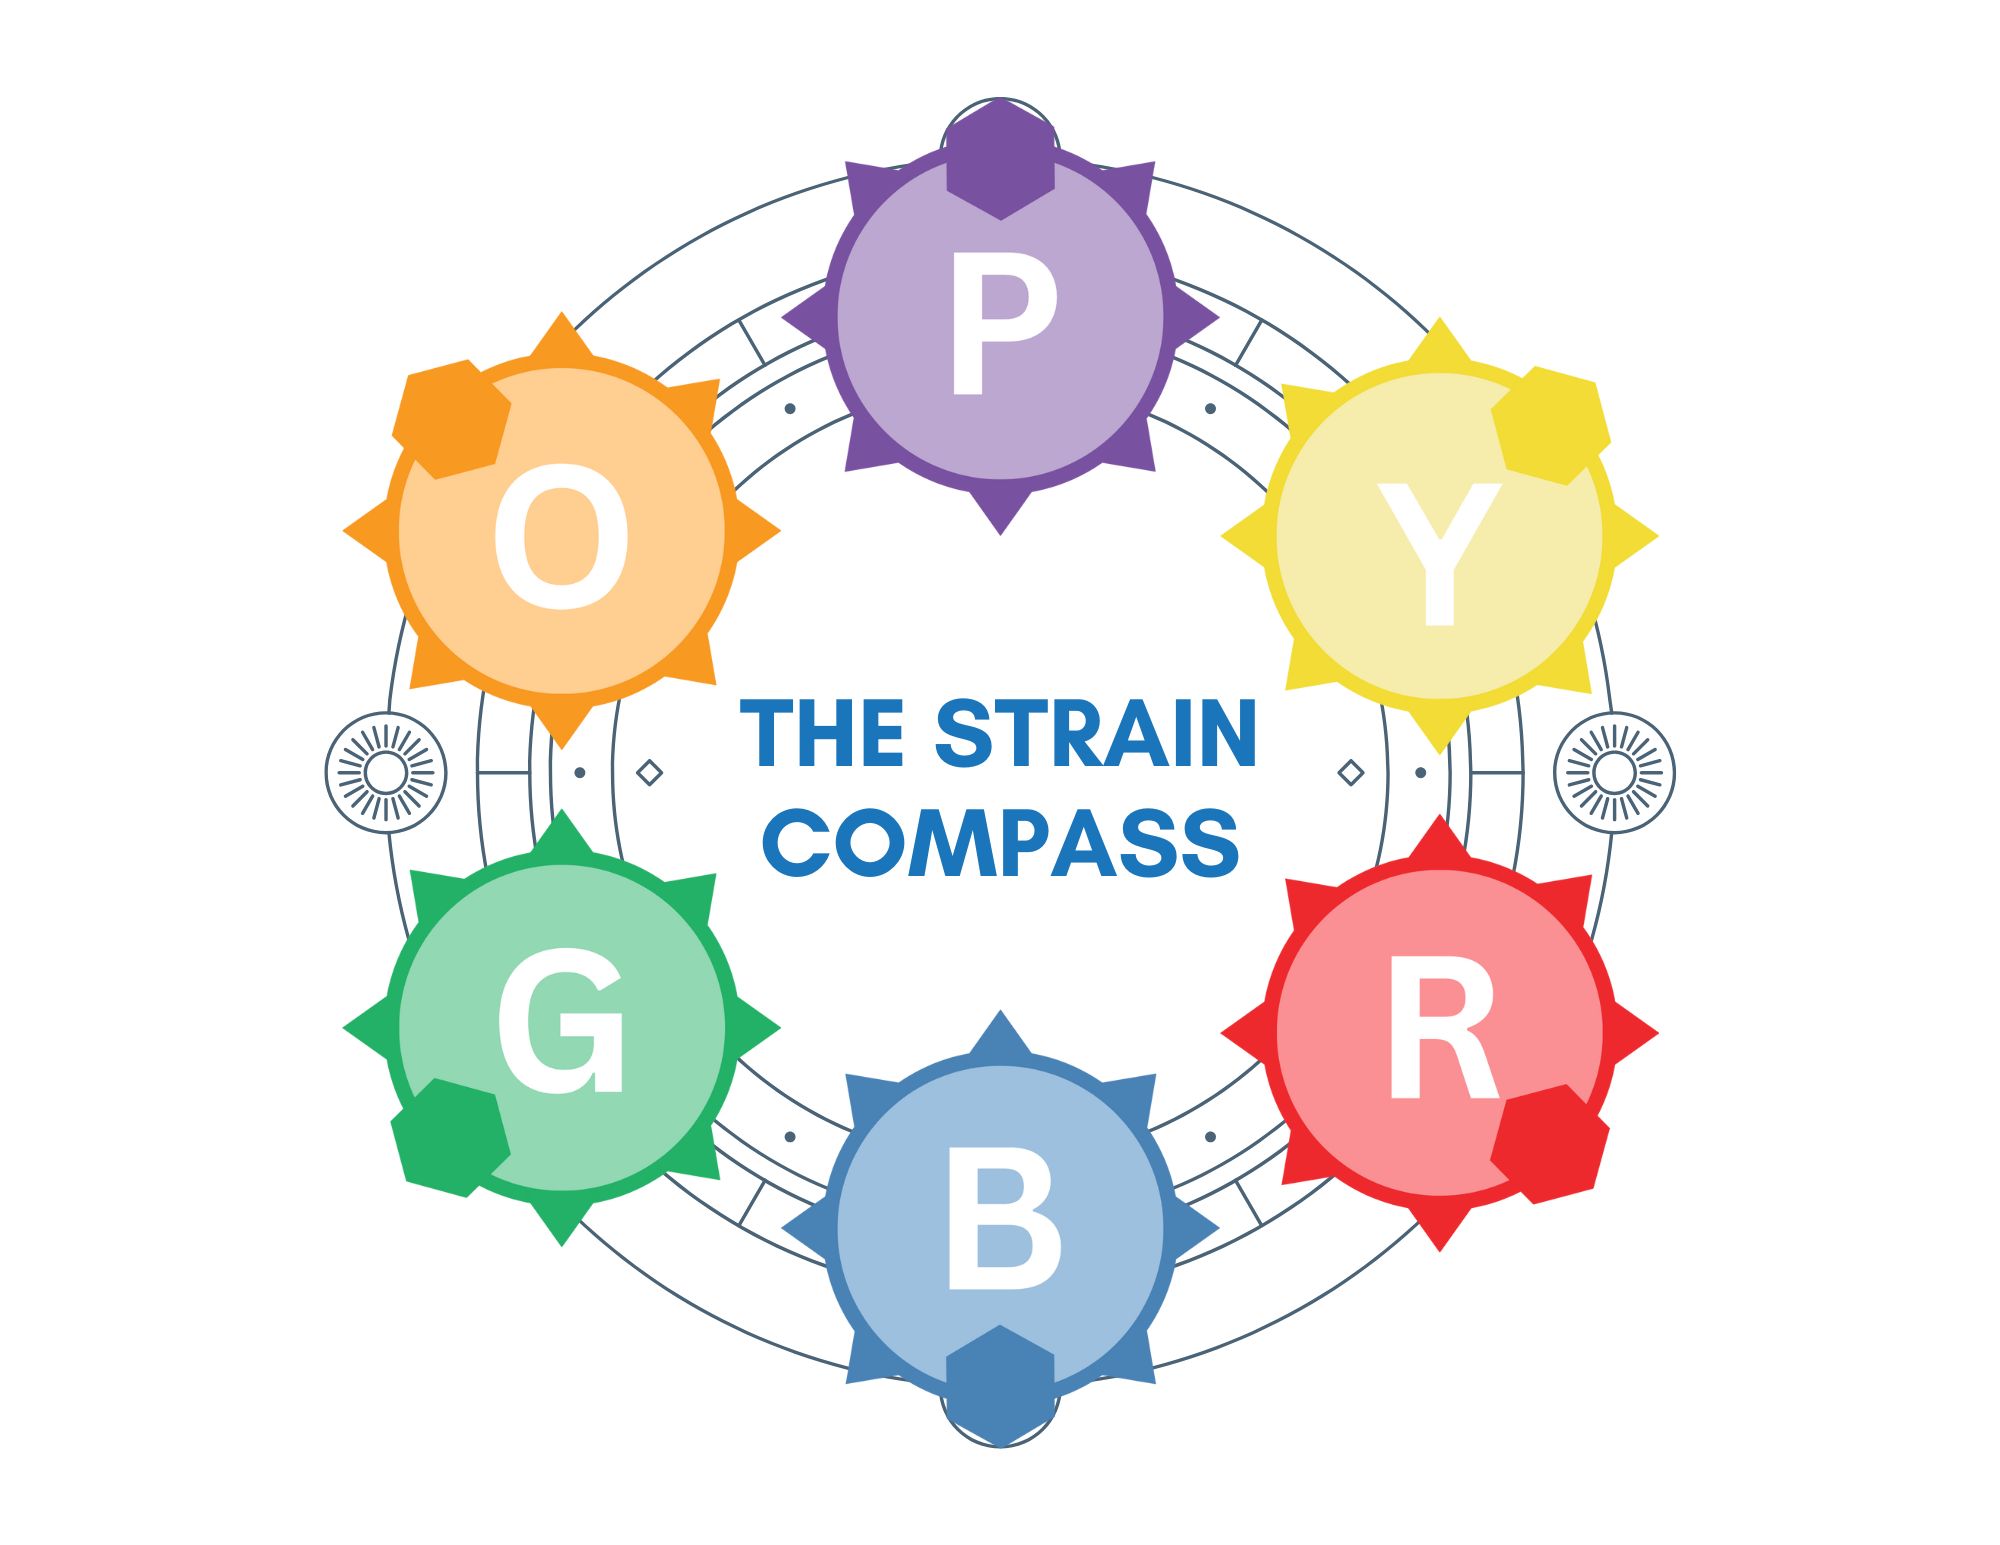
Introducing the Strain Compass™ Categories
Finding your favorite products through SDP's color-coded categories.
Science Made Simple.
The Strain Compass™ is a proprietary tool designed to simplify a complex process of discovering and comparing cannabis strains based on their chemical composition.
Through the development of a unique clustering algorithm, SDP identified cannabis products CLUSTER into six distinct categories based on their chemical profile, defined primarily by the most dominant terpene or combination of terpenes.
The Strain Compass™ categories organize the vast diversity of strains into an accessible format we believe will help consumers identify strains that align with their preferences for flavor, aroma, or effects. We assert that the Strain Compass™ is not just a navigation tool but a comprehensive guide for exploring the world of cannabis.
EXPLORE BELOW
How To Use The Strain Compass™
A Step-by-step explanation of how to use the Strain Compass™ categories and Strain Compass™ charts to find the ideal cannabis product.
Start looking for the Strain Compass™ on the cannabis products you purchase. This can either be found on the store's menu (if they use POSaBIT) or on the cannabis product's lab report. Pay attention to the color of the Strain Compass™ icon. Did you like the product? What kind of effect did you experience? Was it what you were looking for? If yes, move on to step 2. If no, keep exploring each Strain Compass™ category to find the one(s) you like best.
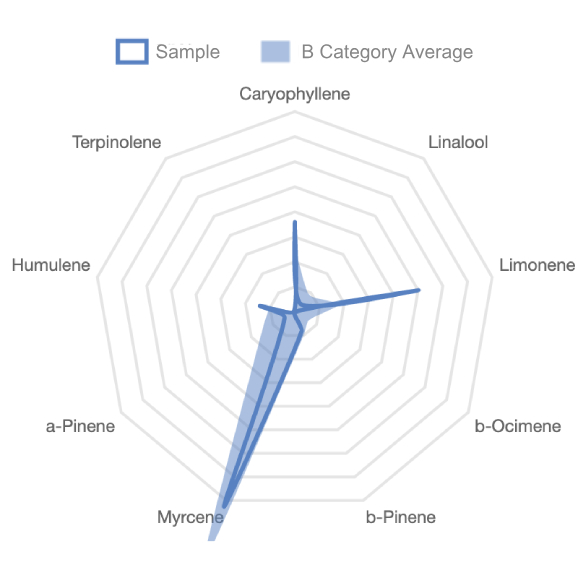
Once you’ve identified your preferred Strain Compass™ category (or categories), take a closer look at each product’s unique Strain Compass™. Compare the product's unique expression (the dark outline) to the category average (the shaded area). While products within the same category share similarities, each has distinct characteristics that set it apart.
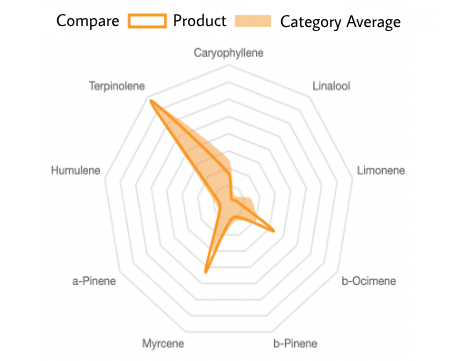
Do you find that you prefer certain products within a Strain Compass™ category more than others? The Strain Compass™ can help you understand why. For example, in the first chart below, the product has higher levels of α-Pinene and Humulene and slightly less Myrcene compared to the category average.
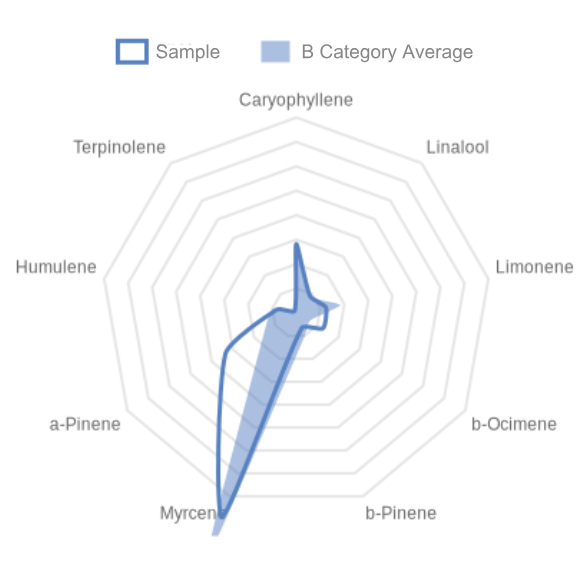
In the second example, the SDP Blue Category product contains more Limonene and Caryophyllene, which we postulate offers a different experience. While both products clearly belong in the SDP Blue Category, these variations make each product unique.
Recognizing these subtle differences may provide you with information to refine your choices and better tailor your cannabis experience.
-
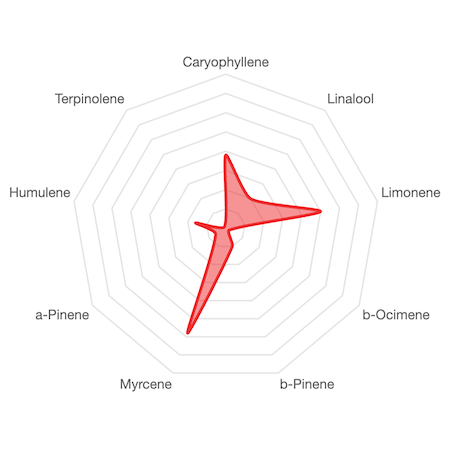
The SDP RED Category RED
The SDP RED Category is defined by the terpenes Myrcene, Limonene, and Caryophyllene being represented in roughly equal amounts, and is usually low in Pinene and Humulene.
----------
Hover over the Strain Compass™ icon to see the AVERAGE compass expression for the RED category.

RED
-
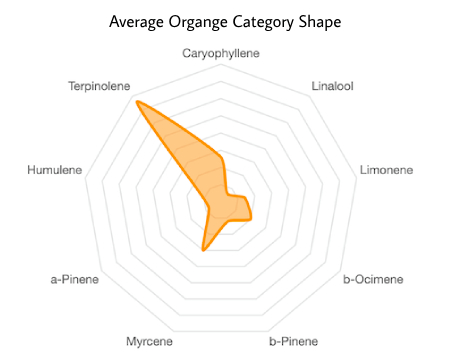
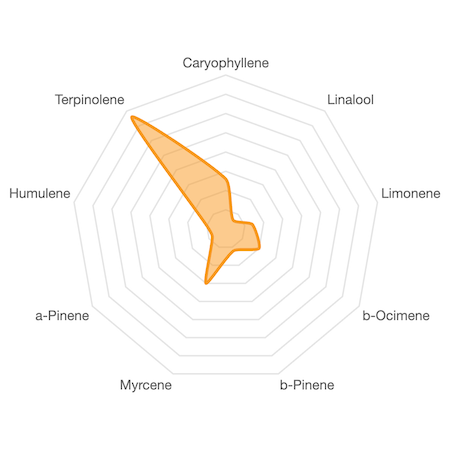
The SDP ORANGE Category ORANGE
The SDP ORANGE Category is defined by the dominance of Terpinolene, making this a very distinct category. There are also notable amounts of Myrcene and b-Ocimene.
----------
Hover over the Strain Compass™ icon to see the AVERAGE compass expression for the ORANGE category.

ORANGE
-
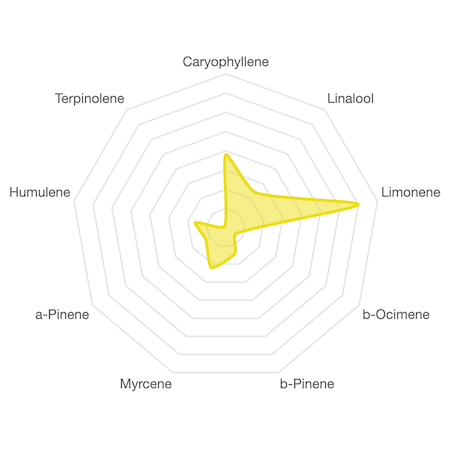
The SDP YELLOW Category YELLOW
The SDP YELLOW Category is defined by the dominance of Limonene. This category also features notable amounts of Caryophyllene and Linalool, with appreciable amounts of Pinene.
----------
Hover over the Strain Compass™ icon to see the AVERAGE compass expression for the YELLOW category.

YELLOW
-
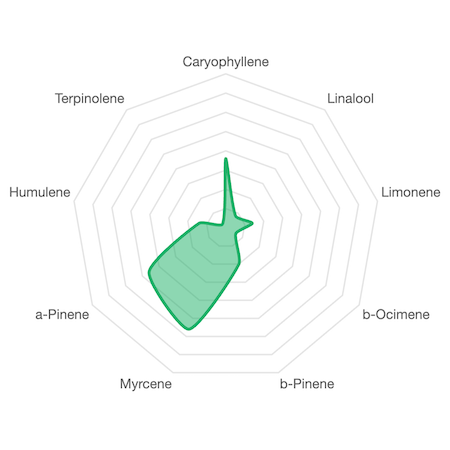
The SDP GREEN Category GREEN
The SDP GREEN Category is defined by the dominance of Pinene. This category is a very rare and diverse category, with notable amounts of a-Pinene, Myrcene and Caryophyllene.
----------
Hover over the Strain Compass™ icon to see the AVERAGE compass expression for the GREEN category.

GREEN
-
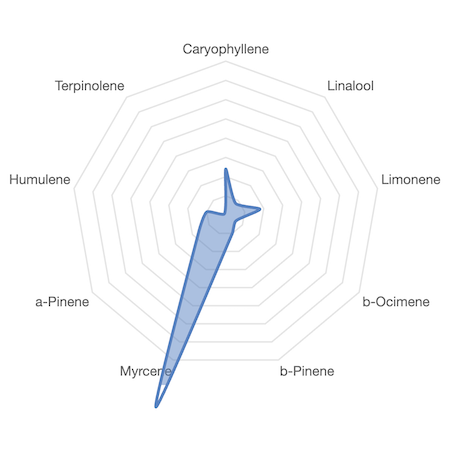
The SDP BLUE Category BLUE
The SDP BLUE Category is dominated by the presence of Myrcene. While this category can have variable amounts of other terpenes, Myrcene by far plays the dominant role.
----------
Hover over the Strain Compass™ icon to see the AVERAGE compass expression for the BLUE category.

BLUE
-
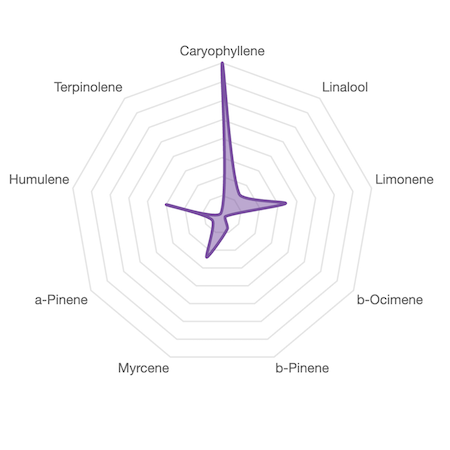
The SDP PURPLE Category PURPLE
The SDP PURPLE Category is dominant in Caryophyllene. This category also features notable amounts of Limonene, Humulene, and Myrcene, and is typically low in Pinene.
----------
Hover over the Strain Compass™ icon to see the AVERAGE compass expression for the PURPLE category.

PURPLE