
Welcome to the Strain Data Project
Explore the Spectrum of Cannabis, One Color at a Time.
A New, More Accurate Way, to Classify Cannabis
Have you ever felt that there was more to cannabis than simply Sativa or Indica? Well, you’re right.
With state of the art technology we’ve analyzed thousands of strains and mapped millions of data points allowing us to create a brand new, much more accurate way of categorizing cannabis.
This powerful tool groups each strain tested into 1 of 6 different color categories.

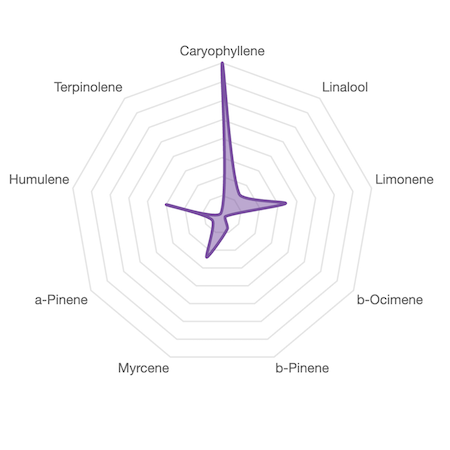
PURPLE
Caryophyllene dominant. Also features notable amounts of Limonene, Humulene, and Myrcene, while typically low in Pinene.

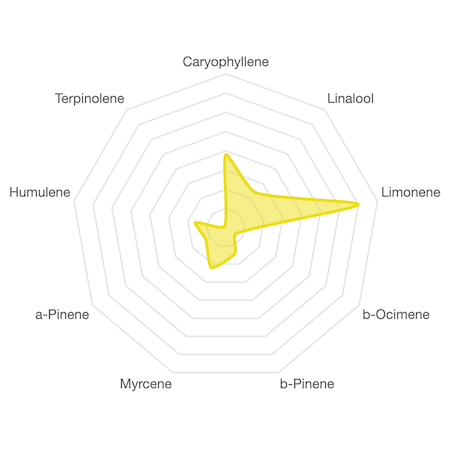
YELLOW
Limonene dominant. Also features notable amounts of Caryophyllene and Linalool, with appreciable amounts of Pinene.

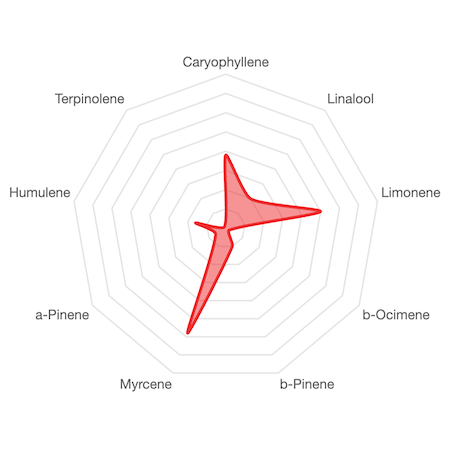
RED
Dominant in Myrcene, Limonene and Caryophyllene in roughly equal amounts. Usually low in Pinene and Humulene.

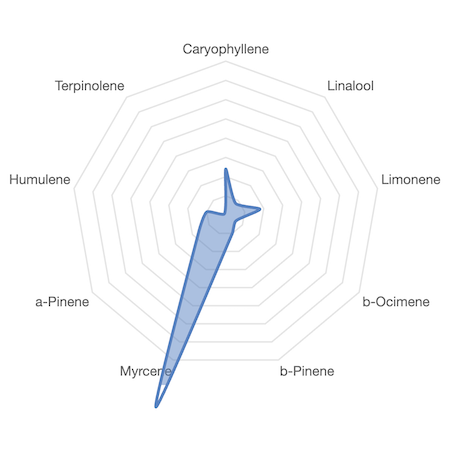
BLUE
Myrcene dominant. While this category can have variable amounts of other terpenes, Myrcene by far plays the dominant role.

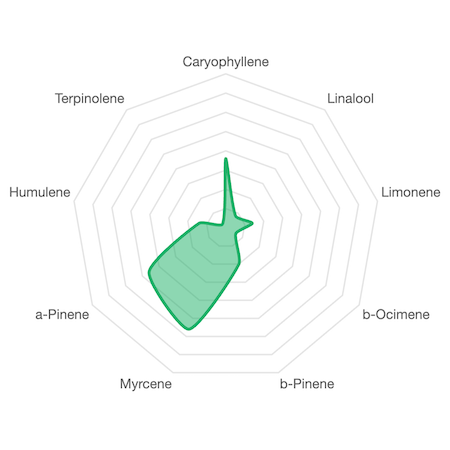
GREEN
Pinene dominant. The Green category is a very rare and diverse category, with notable amounts of a-Pinene, Myrcene and Caryophyllene.

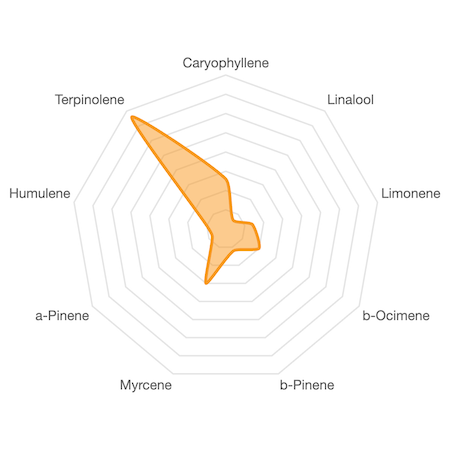
ORANGE
Terpinolene dominant. Very distinct category. Notable amounts of Terpinolene, Myrcene and b-Ocimene.
-
About SDP The Need for a Better Cannabis Classification System
The cannabis market is flush with products from countless brands, making product selection an overwhelming experience. However, research from The Strain Data Project (SDP) has shown that while each cannabis product has unique qualities, they can be conveniently grouped into six distinct categories based on the strain’s chemical composition. Using a clustering algorithm, SDP identified these categories based on the chemical profiles of strains, primarily defined by the dominant terpene or terpene combination in each strain. To make these insights as approachable as possible, each category is represented by a unique color and standardized radar chart that visually represents each category. Discovering your favorite color can help guide you to the products you’ll love most—it’s that simple.
Learn more here.
PURPLE
YELLOW
RED
BLUE
GREEN
ORANGE
-
Insights Section Strain Compass Insights
The Strain Compass becomes especially powerful when used to compare the category shape to the shape a strain makes on the same radar chart. This not only shows the strain in a category, but also clearly highlights the unique chemical profile of that particular strain when compared to the average for that category.
Strains with similar chemical profiles will be placed in the same category, as they are located close to one-another in the Strain Category Universe. However, each strain will be slightly different than the average for that category, showcasing its unique composition.
Additionally, the Strain Compass provides a thumbprint of the strain that can be compared to itself over time. Showing how much variation is occurring between batches.
Learn more here.
Orange Category Icon
Orange Category Compass
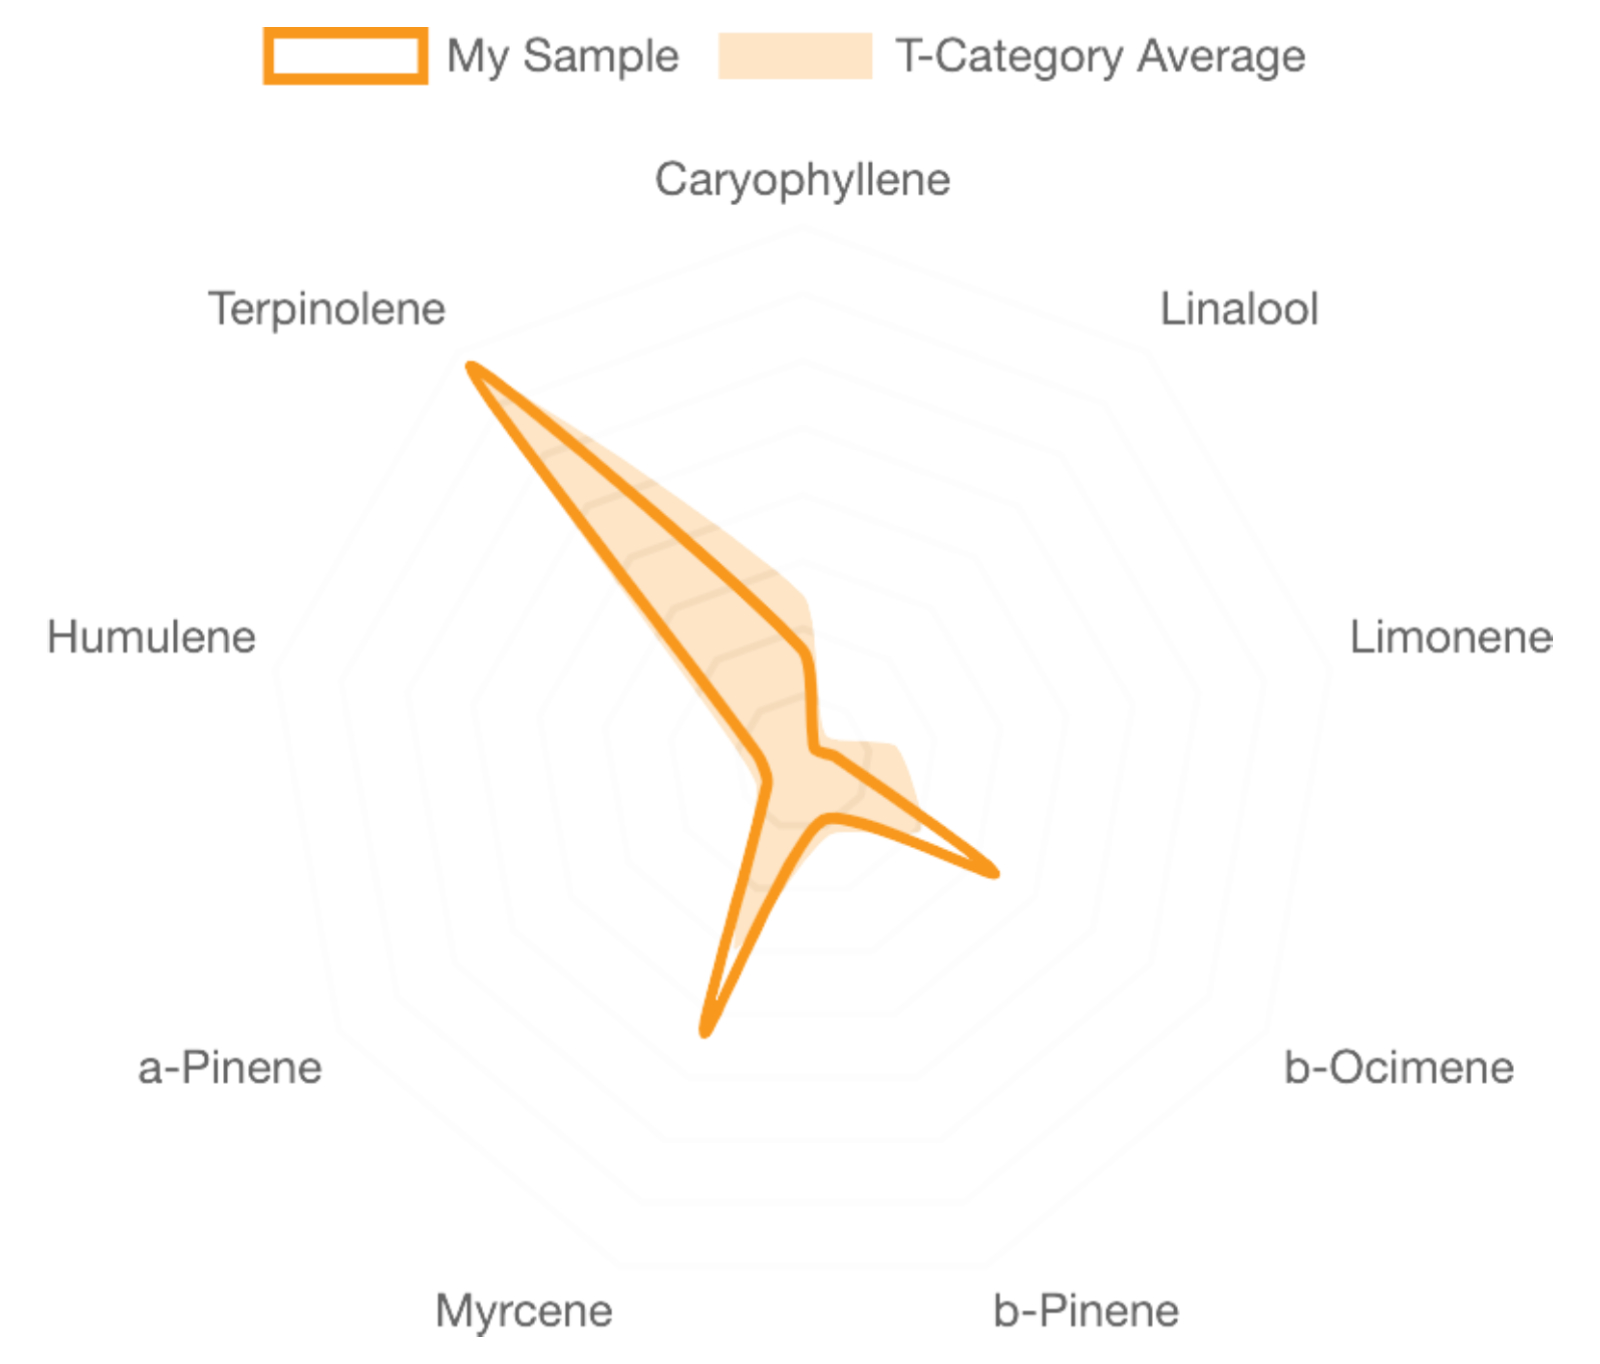
Strain Specific Orange Category
-
Benefits Section Strain Compass Benefits
Below are just a handful of the benefits the compass can provide.
- Replaces dependence on the sativa/indica/hybrid paradigm. The Strain Compass showcases the actual chemical profile of a product which is a better predictor of the experience a consumer will have.
- Provides easily digestible visual information; a simple color coded visual map that helps make the information about a product more accessible.
- Provides a way to differentiate the product or communicate its characteristics more easily.
- Can help to provide confirmation that the product is identified correctly; helping to demystify what a product actually is.
- Makes it easier to tell how much variation is occurring between batches; easier than any other information on the lab report.
Find out more about how the compass was developed by reading our research summary.
The Science Behind the Strain Compass
Learn how the Strain Compass was created. Fill out the form to get your free copy of our white paper!