ABOUT THE STRAIN COMPASS
The compass is part of a larger research effort called the Strain Data Project (SDP), from which this information was derived.
SDP utilized data from thousands of tested cannabis samples. The data was analyzed and aggregated in order to discover similarities and differences between cannabis products.

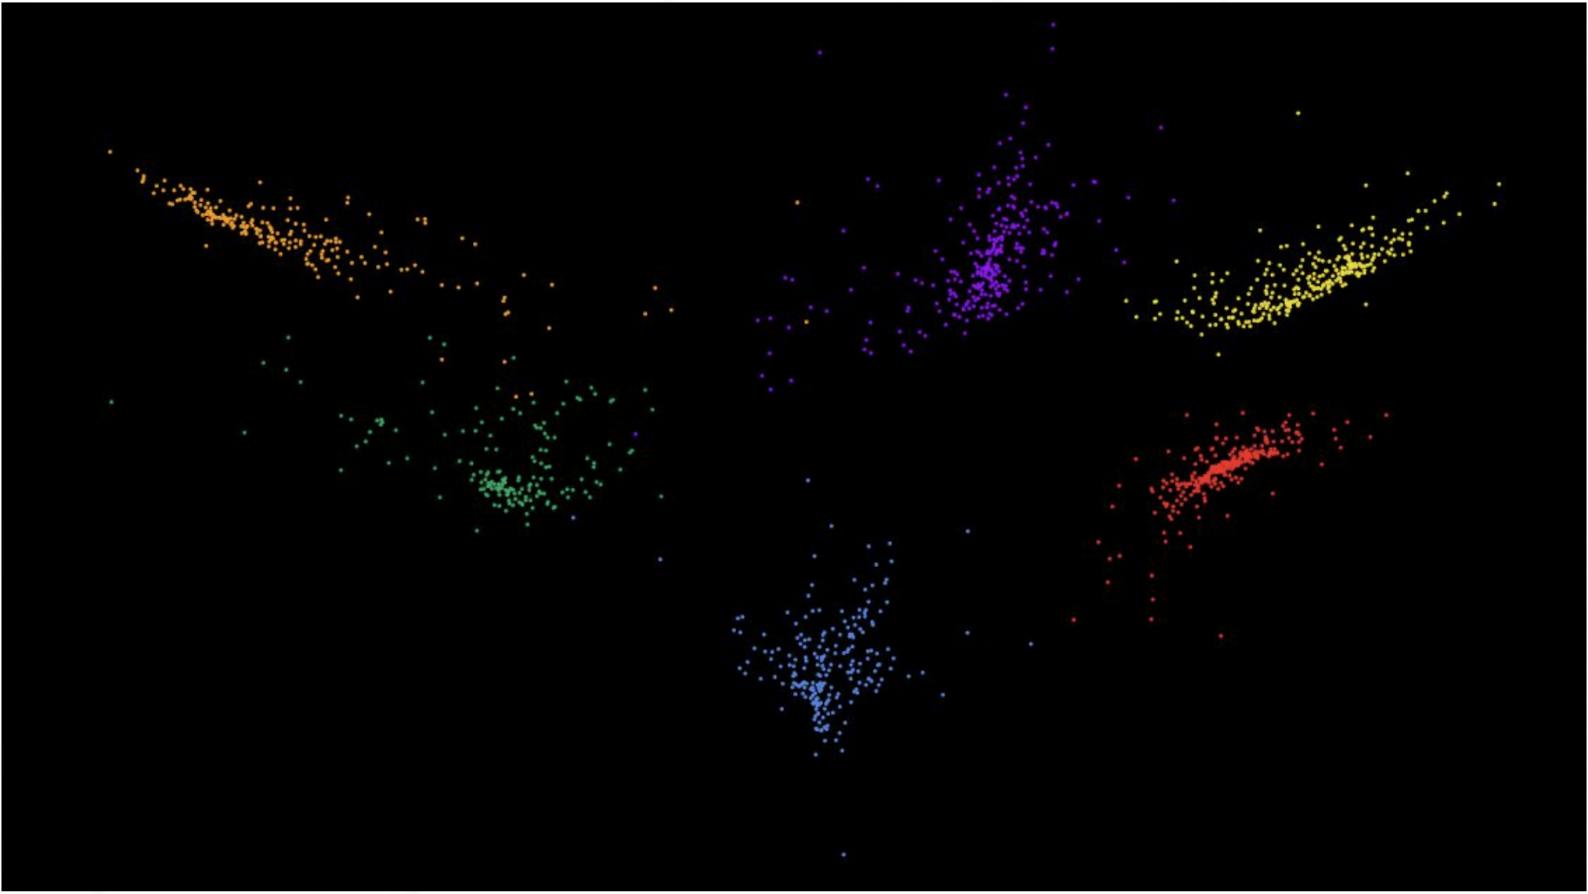
Through the development of a clustering algorithm SDP found the recreational cannabis market CLUSTERED into six distinct product categories based on their chemical profile.
.png)
Each category is defined primarily by the most dominant terpene or combination of terpenes. This creates a signature shape on a radar chart.
A standardized radar chart is utilized in order to create a visual shape for each category.

